A Bi-Monthly Analysis of UHNW Asset Liquidity
Key Trends in UHNW Asset Liquidity
Standard market indicators (which typically measure sector specific transaction value, volume, and pricing) often fail to directly capture the unique and nuanced pressures affecting illiquid assets that high-net-worth individuals and families hold in their portfolios.
To address this gap and provide a clearer view of liquidity across unique assets, we developed the Leyster Liquidity Strength Index, a proprietary framework that incorporates factors such as shifting tastes, embedded leverage by asset type, and the market breadth of qualified buyers and sellers – each of these factors have significant, but varying, impacts on the overall liquidity scores we assign through our analysis.
The Leyster Liquidity Lens is our bi-monthly analysis powered by this index. It provides advisors and their clients with a consistent, data-driven view on the ease (or difficulty) with which private and alternative assets can be converted to cash. UHNW investors typically hold multiple illiquid positions, making it crucial to distinguish which can be mobilized quickly and which cannot.
Comments on changes from February 2026 to April 2026:
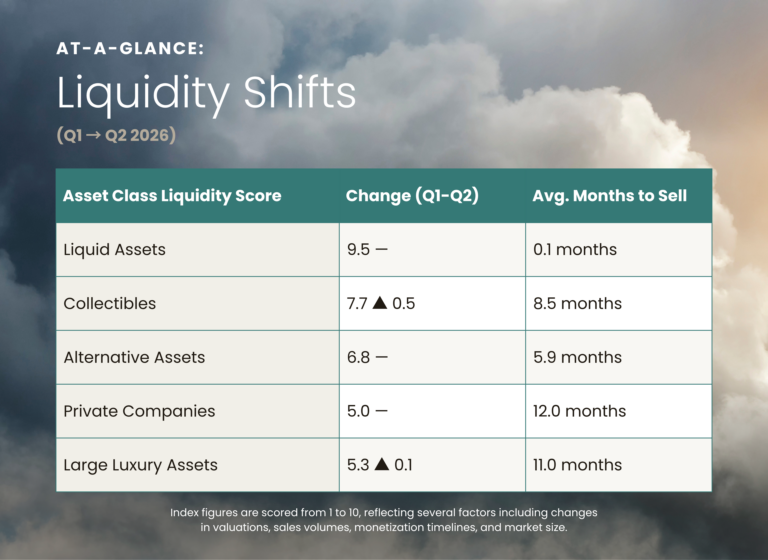
Collectibles:
There is a sense of sustained optimism on full display at the ultra high end of collectibles markets. Whether it’s a renewed push for diversification, a result of asset price inflation, or just plain optimism, there is no question that demand for blue chip assets is higher today than it was at this point last year.
- Collector Cars: March’s Florida auctions continued record setting momentum established in January’s auctions. Across the big 3 sales from Broad Arrrow, RM, and Gooding, 363 cars traded hands for $256 million, reflecting an average sale price of over $700,000. From 2025 to 2026 across these same auctions, total sales grew by 31%, average price grew by 24%, and sell through rates jumped from 88% to 92%.
- Fine Art: March sales at Sotheby’s, Christie’s, and Phillips auctions in London grew by over 50% YOY to $550 million. With the release of the 2026 UBS Art Basel report in March, we now have clear data confirming the art market’s recovery. Notably, the number of unique buyers at top dealers rose 40% YOY to 125. While still below 2023 levels, the rebound signals that most serious collectors have returned to the market.
Large Luxury Assets:
While a flight to ultra high quality assets in the collectible markets has spilled into some tertiary collectible assets, this is not the case for large luxury assets. While demand for trophy assets from the right manufacturers, or in the right zip codes is reaching new heights, much more consideration is preceding these acquisitions.
-
Luxury Homes: Per Compass, 56 $10 million homes sold in Manhattan during Q1 2026, this represents a nearly 50% YOY increase from Q1 2025. Pristine homes in scarce, exclusive markets are finding buyers at record pace, while homes that need a little work, or are just a bit too far out of town are beginning to take longer to sell. Over the next 12 months of $10+ million home sales, we expect to see rising averages mask plateauing medians.
Alternative Assets:
To the individual UHNW investor, liquidity secured by alternative assets is more accessible today than at any prior point in history. That said, crunches in private credit and a more challenging private equity fundraising environment could have cascading effects on the ease of that liquidity down the line.
Leyster Takeaway
In the face of global instability and institutional investor redemption crisis, the UHNW cohort kept buying, and seemed fully insulated during Q1 2026. We do not expect this trend to continue forever, but from our conversations with UHNWIs and their advisors, we expect our June update to stay largely the same.
DISCLOSURE:
METHODOLOGY
Leyster Capital’s Liquidity Strength Index is a proprietary framework designed to assess the relative ease with which ultra-high net worth (UHNW) assets can be converted to cash—without sacrificing control or value. Each asset category is assigned a score reflecting its liquidity profile based on real-time market behavior, financing accessibility, and buyer dynamics.
- Low Liquidity Scores indicate assets with constrained buyer pools, elongated sale timelines, and limited financing options. These are typically one-of-a-kind or highly specialized holdings, such as large superyachts or highly bespoke real estate.
- Moderate Liquidity Scores reflect stable-to-growing asset classes with active buyer markets, evolving valuations, and expanding capital solutions. Collector cars and high-value watches often fall within this range.
- High Liquidity Scores are reserved for asset classes that benefit from deep capital markets, short transaction cycles, and consistent financing access, such as publicly traded securities and select commodities.
Leyster’s metrics are derived from quarterly or semi-annual data across a curated basket of assets, each weighted proportionally to its market size within its segment. Categories include:
- Large Luxury Assets: Ultra-luxury homes, private aircraft, and large yachts.
- Alternative Assets: LP/GP interests in private equity and private credit funds, income-producing commercial real estate, and entertainment royalties.
- Collectibles: Blue-chip collector cars, fine art, rare timepieces, and investment-grade wine.
All liquidity assessments are based on publicly available data from trusted sources including S&P, Pitchbook, Bloomberg, Evercore, UBS Art Basel, Knight Frank, and Cushman & Wakefield.
The assessments are supplemented by publicly available data from reputable sources within niche asset classes including Hagerty, International Federation of the Phonographic Industry, BoatPro, Global Jet Capital, ArtPrice, and Liv-ex. Assessments are further validated by conversations with UHNW asset owners, relevant financing providers, and key advisors.
This methodology underpins Leyster’s ongoing commentary and charting of liquidity stress indicators across UHNW portfolios. It remains consistent across reporting periods and serves as a foundational benchmark in our analysis.