A Bi-Monthly Analysis of UHNW Asset Liquidity
Key Trends in UHNW Asset Liquidity
Navigating the world’s most complex assets requires a very specific set of tools. Traditional market indicators often fail to capture the unique pressures affecting the illiquid holdings we often see in the portfolios of high-net-worth individuals and families.
To address this gap, we developed the Leyster Liquidity Strength Index, a proprietary framework designed to translate opaque market signals into a clear, actionable perspective.
The Leyster Liquidity Lens is our bi-monthly analysis powered by this index. It provides advisors and their clients with a consistent, data-driven view on the ease with which private and alternative assets can be converted to cash.
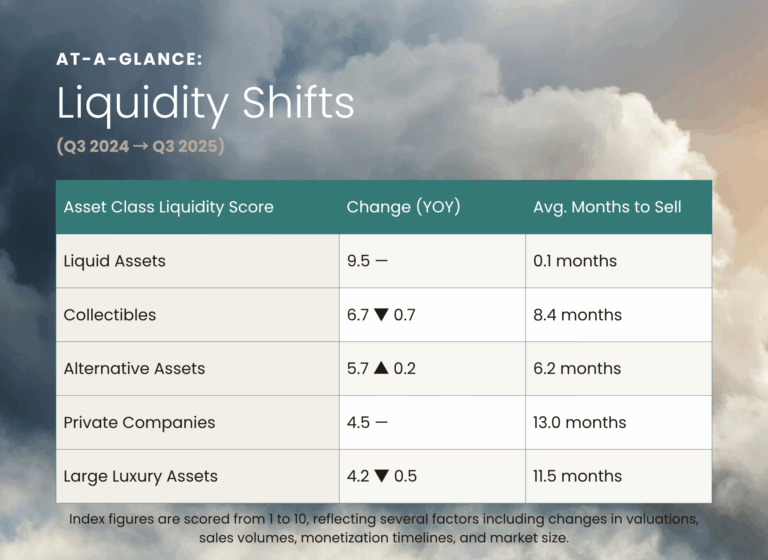
In this inaugural edition, we apply the Index to compare year-over-year shifts from Q3 2024 to Q3 2025. The results reveal a clear theme of significant and accelerating liquidity divergence across major asset classes. Here is what our analysts are seeing:
Collectibles: Stability Masks Structural Shifts
Liquidity across the collectibles category has deteriorated notably over the past 12 months, driven by both transactional data and market behavior.
Fine Art: Sales value and unique buyer participation contracted by double digits, reflecting a sustained pullback in institutional and individual appetite for high-end works.
Collector Cars: Market stability masks internal volatility. The data from Monterey auction week confirms a growing aversion to pre-1980 models priced above $1 million. This marks a generational shift in buyer preference.
Fine Wine: Continues its downtrend, now approaching a 7-year low in market enthusiasm and international demand.
While headline valuations appear flat, the underlying liquidity has softened materially. The bid-ask spread across major auction houses and private dealers is widening, suggesting further repricing may lie ahead.
Alternative Assets: Secondary Mechanics Improve Outlook
Liquidity improved modestly in the alternative asset segment, though the gains are narrowly concentrated in GP/LP secondary markets.
Private Equity & Private Credit: Discounts to NAV on secondaries compressed below the historical 10% mark. Broader acceptance of NAV-based financing and the expansion of structured credit options have enhanced market function.
Real Estate LPs & Royalties: These remain largely flat in terms of liquidity, with little material change in absorption or financing availability.
Taken in full, the data shows cautious optimism for fund interests. However, this sentiment does not yet extend to underlying assets with more idiosyncratic profiles.
Large Luxury Assets: Market Softness, Not Panic
A modest downward revision in liquidity metrics was observed in large luxury assets, particularly residential real estate at the top end.
Ultra-Luxury Real Estate: Key markets, most notably London, have been affected by regulatory tightening (including the non-dom tax policy shift). Properties are increasingly priced to sell, but often remain on market for extended periods.
Private Jets & Yachts: Liquidity conditions remain roughly in line with last year. Transaction volumes are steady but concentrated at the top 10% of the market.
While not indicative of distress, the elevated time-on-market signals increasing sensitivity to pricing and carrying costs.
Leyster Takeaway
In a climate of rising policy friction and recalibrated expectations, liquidity divergence is the dominant force. Asset types that once moved in concert are now decoupling in terms of capital access and buyer confidence. For advisors, this new landscape demands proactive strategy. Now is the time to pressure-test portfolio assumptions and rehearse readiness, well before the headlines break.
DISCLOSURE:
METHODOLOGY
Leyster Capital’s Liquidity Strength Index is a proprietary framework designed to assess the relative ease with which ultra-high net worth (UHNW) assets can be converted to cash—without sacrificing control or value. Each asset category is assigned a score reflecting its liquidity profile based on real-time market behavior, financing accessibility, and buyer dynamics.
- Low Liquidity Scores indicate assets with constrained buyer pools, elongated sale timelines, and limited financing options. These are typically one-of-a-kind or highly specialized holdings, such as large superyachts or highly bespoke real estate.
- Moderate Liquidity Scores reflect stable-to-growing asset classes with active buyer markets, evolving valuations, and expanding capital solutions. Collector cars and high-value watches often fall within this range.
- High Liquidity Scores are reserved for asset classes that benefit from deep capital markets, short transaction cycles, and consistent financing access, such as publicly traded securities and select commodities.
Leyster’s metrics are derived from quarterly or semi-annual data across a curated basket of assets, each weighted proportionally to its market size within its segment. Categories include:
- Large Luxury Assets: Ultra-luxury homes, private aircraft, and large yachts.
- Alternative Assets: LP/GP interests in private equity and private credit funds, income-producing commercial real estate, and entertainment royalties.
- Collectibles: Blue-chip collector cars, fine art, rare timepieces, and investment-grade wine.
All liquidity assessments are based on publicly available data from trusted sources including UBS Art Basel, Knight Frank, Cushman & Wakefield, S&P, Pitchbook, Bloomberg, and Evercore.
The assessments are also supplemented by publicly available data from reputable sources within niche asset classes including Hagerty, International Federation of the Phonographic Industry, BoatPro, Global Jet Capital, ArtPrice, and Liv-ex.
This methodology underpins Leyster’s ongoing commentary and charting of liquidity stress indicators across UHNW portfolios. It remains consistent across reporting periods and serves as a foundational benchmark in our analysis.